The cryptocurrency market is notoriously volatile – one minute prices are flying and the next, portfolios are being decimated. In this crypto beginner guide, you’ll learn how to spot the difference between a bull and a bear market using several indicators.
The Beasts of the Market
What is a Bull Market?
A bull market is a period of sustained price appreciation, often characterized by widespread optimism, increasing demand, and a general belief that prices will continue to climb. The "bull" charges upwards, mirroring the upward thrust of its horns. Investors in a bull market are often driven by a sense of FOMO (Fear of Missing Out), eagerly buying into assets as they see others profiting.
In 2017 for example, Bitcoin’s price surged from around $200 to nearly $20,000. This was an unprecedented leap at the time. Word on the street was that the flagship currency was going to reach $100,000 in the same year and disrupt traditional finance.
One of the key signs of a bull market is the influx of new projects – ICOs, NFTs, meme coins, etc. Builders and malicious actors try to capitalize on the positive sentiments in the market.
What is a Bear Market?
A bear market is marked by a prolonged downturn in prices. It is typically fuelled by pessimism, fear, and a tendency for supply to outweigh demand. The "bear" swipes downwards with its paws, reflecting the downward trajectory of prices.
During a bear market, investors may be gripped by FUD (Fear, Uncertainty, and Doubt), leading to panic selling and a prevailing sense of caution.
While traditional markets often define a bull or bear market by a 20% price movement, crypto's inherent volatility means these percentages can be far more extreme. Bitcoin, for instance, has seen corrections of over 80% during its "crypto winters."
Key Indicators to Watch out for
Discerning a bull from a bear market requires looking past the immediate price action. While no single metric is foolproof, let's break down the key tools traders and analysts depend on.
Price Trends and Trading Volume
In a bull market, prices exhibit a consistent upward trend over weeks or months, forming higher highs and higher lows. This upward movement is accompanied by robust trading volumes. More liquidity enters that market and there is a strong buying pressure. Each dip is often met with eager buyers, seeing it as an opportunity to accumulate.
On the flip side, prices show a prolonged downward trend in a bear market. Prices fall to new lows and trading volume tends to dwindle as buyer interest wanes and fear dominates. Even minor rallies are often short-lived and met with selling pressure.
Did you know? Following the bull run of late 2017, the price of Bitcoin crashed by 84%. After hitting a then all-time-high of nearly $20,000, prices tumbled to $12,000 in the days that followed. The price of Bitcoin continued to decline throughout 2018, eventually dropping to around $3,000.
Investor Sentiment
You’ve probably experienced this in a bull market - the air is thick with euphoria. Social media buzzes with optimistic predictions such as "to the moon." New projects also launch with sky-high valuations, and even mainstream media starts covering crypto extensively.
This collective optimism fuels further buying. Tools like the Crypto Fear & Greed Index show "Greed" or "Extreme Greed."

Fear and capitulation reign in a bear market. Headlines turn grim, social media discussions become quiet or filled with despair, and even long-term holders might question their convictions. Funding for new projects dries up, and jokes about "exit liquidity" become common. The Fear & Greed Index will likely show "Fear" or "Extreme Fear."
Economic and Macro Factors
Bull markets often align with periods of economic growth, low interest rates, and easy access to credit. During the 2020-2021 bull run, for example, pandemic-era stimulus checks and low borrowing costs provided ample capital for investors to deploy into risk assets like crypto. In contrast, bear markets can be exacerbated by adverse macroeconomic conditions such as high inflation, rising interest rates, and tightening monetary policies.
When traditional markets struggle, crypto, as a higher-risk asset, often feels the pinch even more acutely. Regulatory uncertainty or crackdowns can also significantly impact sentiment.
Technical Indicators
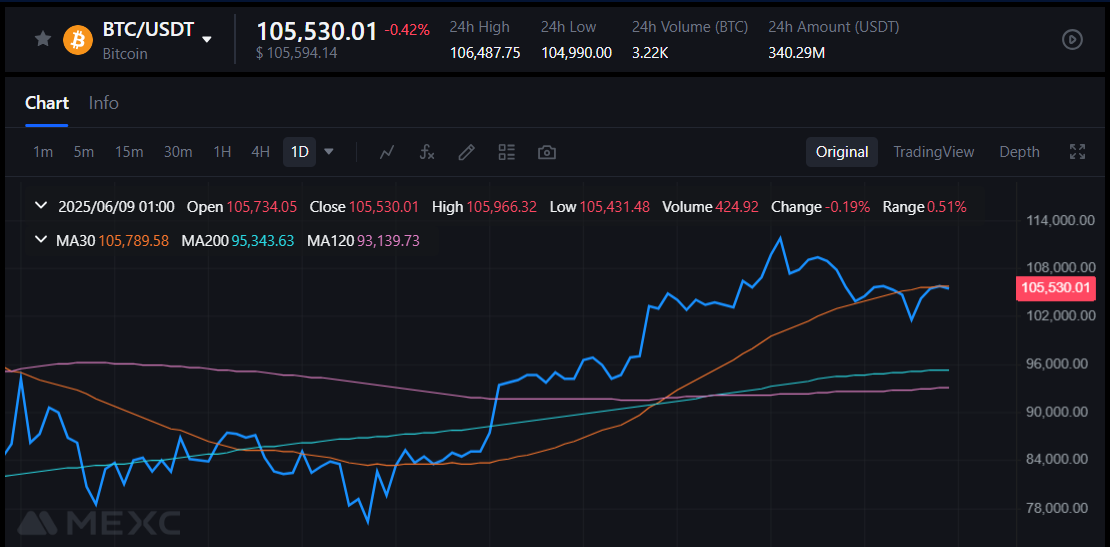
While not definitive, certain technical analysis tools can offer clues. When prices consistently trade above a long-term moving average (like the 200-day Simple Moving Average), it's generally considered a bullish signal. A sustained drop below this line can indicate a shift to a bear market.

Another technical indicator is the relative strength index (RSI). This momentum oscillator can help identify overbought or oversold conditions. An RSI consistently above 70 might suggest an asset is overbought in a bull market, while below 30 could signal an oversold market in a bear phase, potentially indicating a buying opportunity.
Conclusion
A combination of these indicators will help you stay on top of your crypto game. However, I must mention that there are usually price swings in between crypto cycles. Major news like an new institutional player buying crypto or a country banning digital assets could influence the direction of things.


.png)

